
You are here: Start » Getting Started » Preview and Data Presenting
Preview and Data Presenting
Creating and Closing Data Previews
Once you execute filters(tools) in the program it is possible to display their inputs and outputs on the Data Preview panel. To do so, you can drag the input or the output of the filter and drop it on the panel to the right of the Program Editor. Similar types of data such as Image and Region or StringArray and IntegerArray can be displayed on the same preview.
There are several ways of removing elements from the data preview. You can:
- Click the X at the top right corner. In this way, you will remove the last data that has been added to the preview. If the closed one is also the last, the preview window is closed.
- Use the mouse wheel button and press it when mouse cursor is placed on the name of the preview (top left corner).
- Right-click on the name of the preview and select one of the options, which are Remove Preview, Close, Close All But This and Close All.
Arranging Data Previews
There are five default options that you can use to arrange your preview:  . Despite displaying your preview in a single window, you can use four other options:
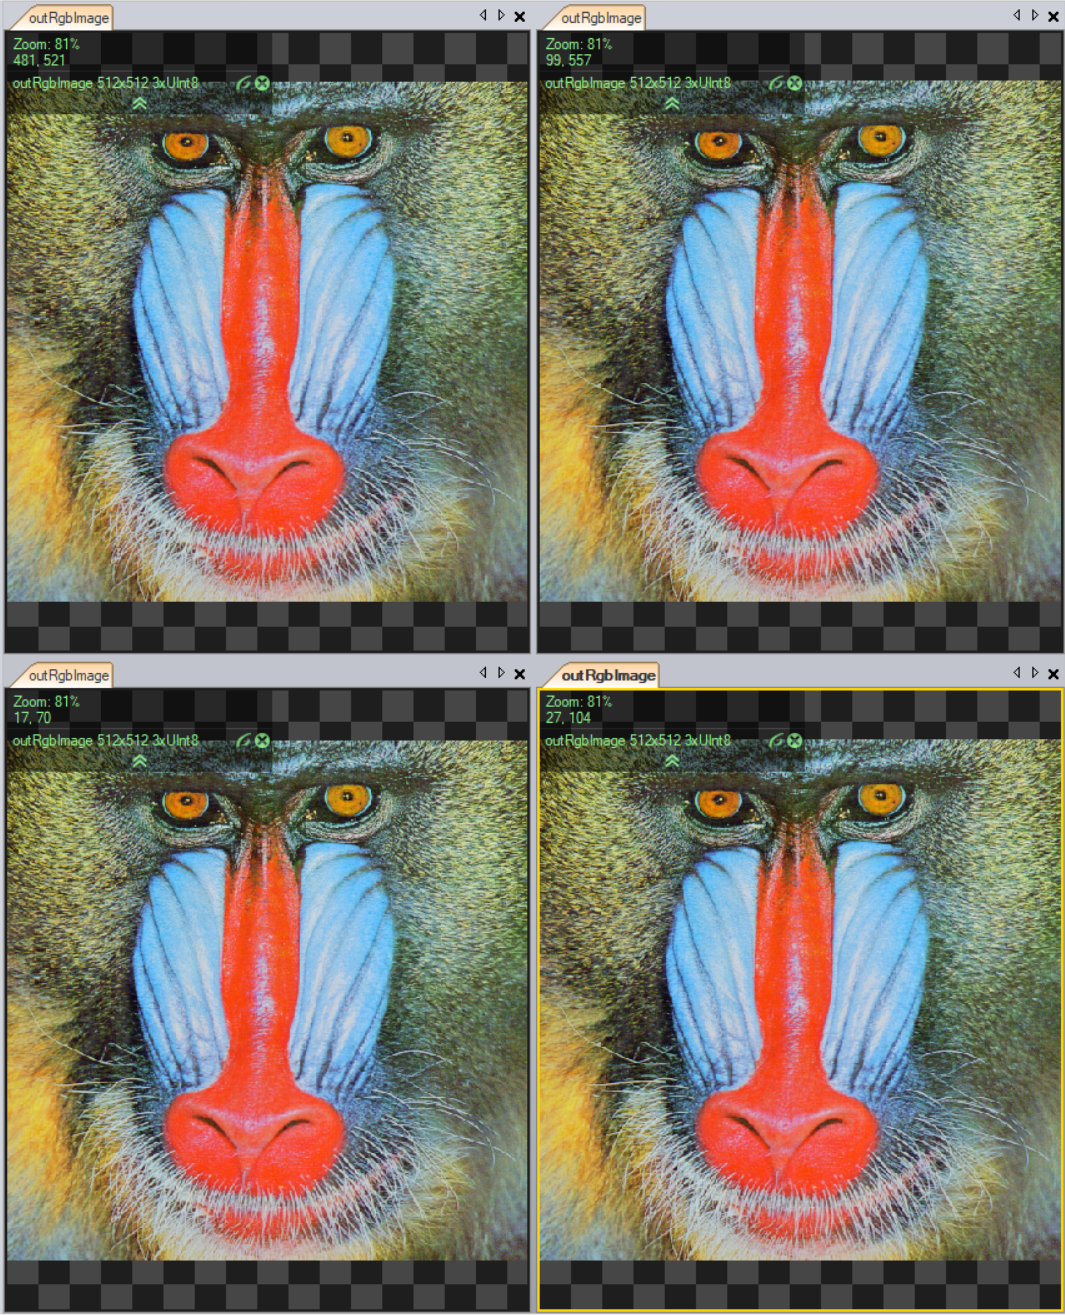
2x2 Split |
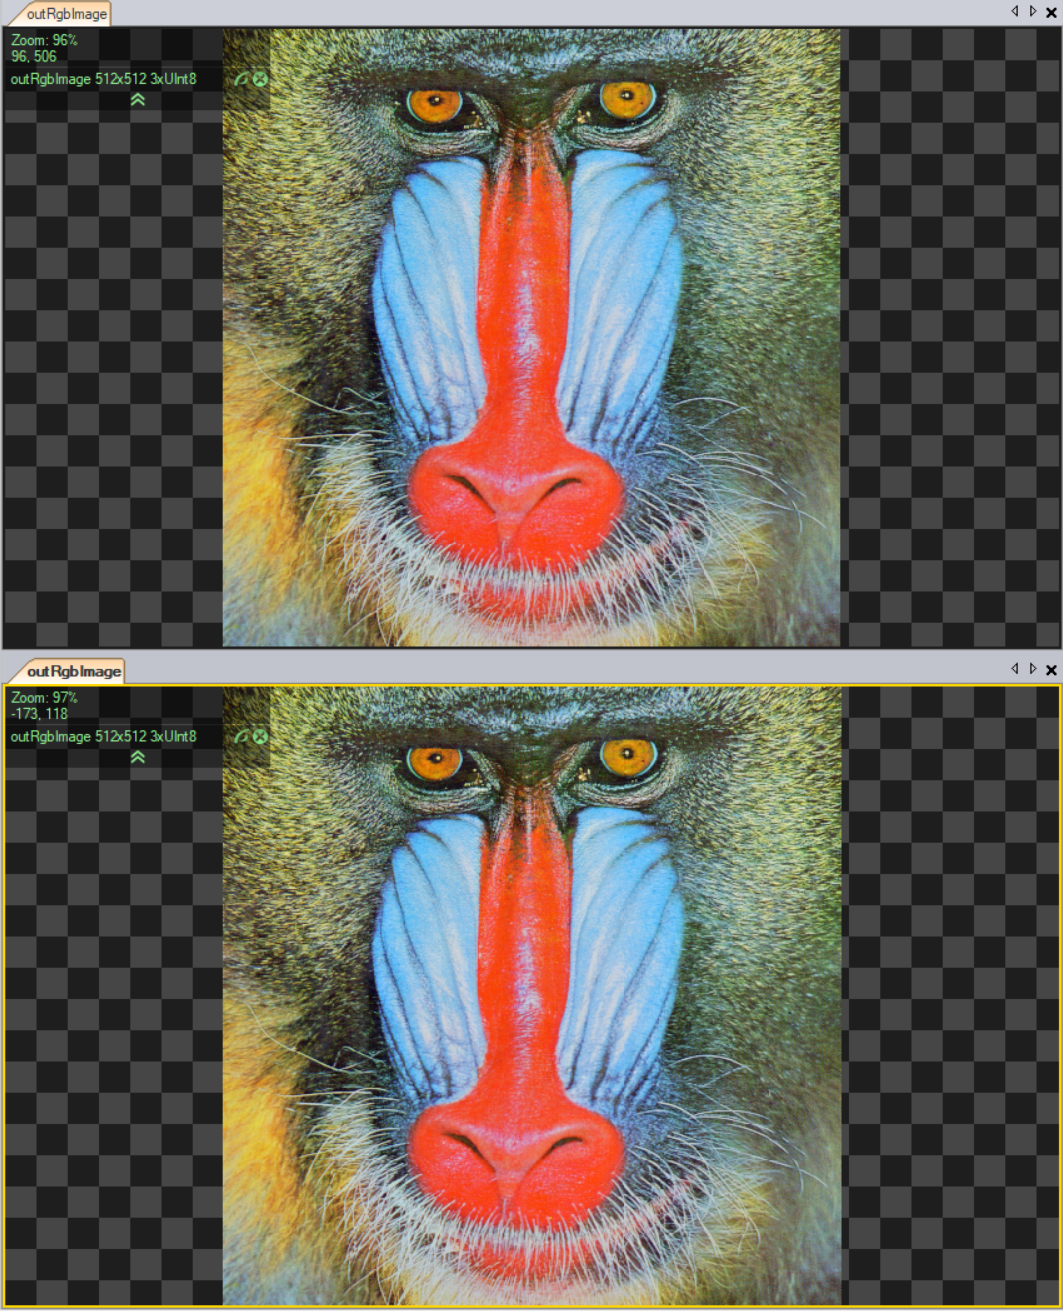
Horizontal Split |
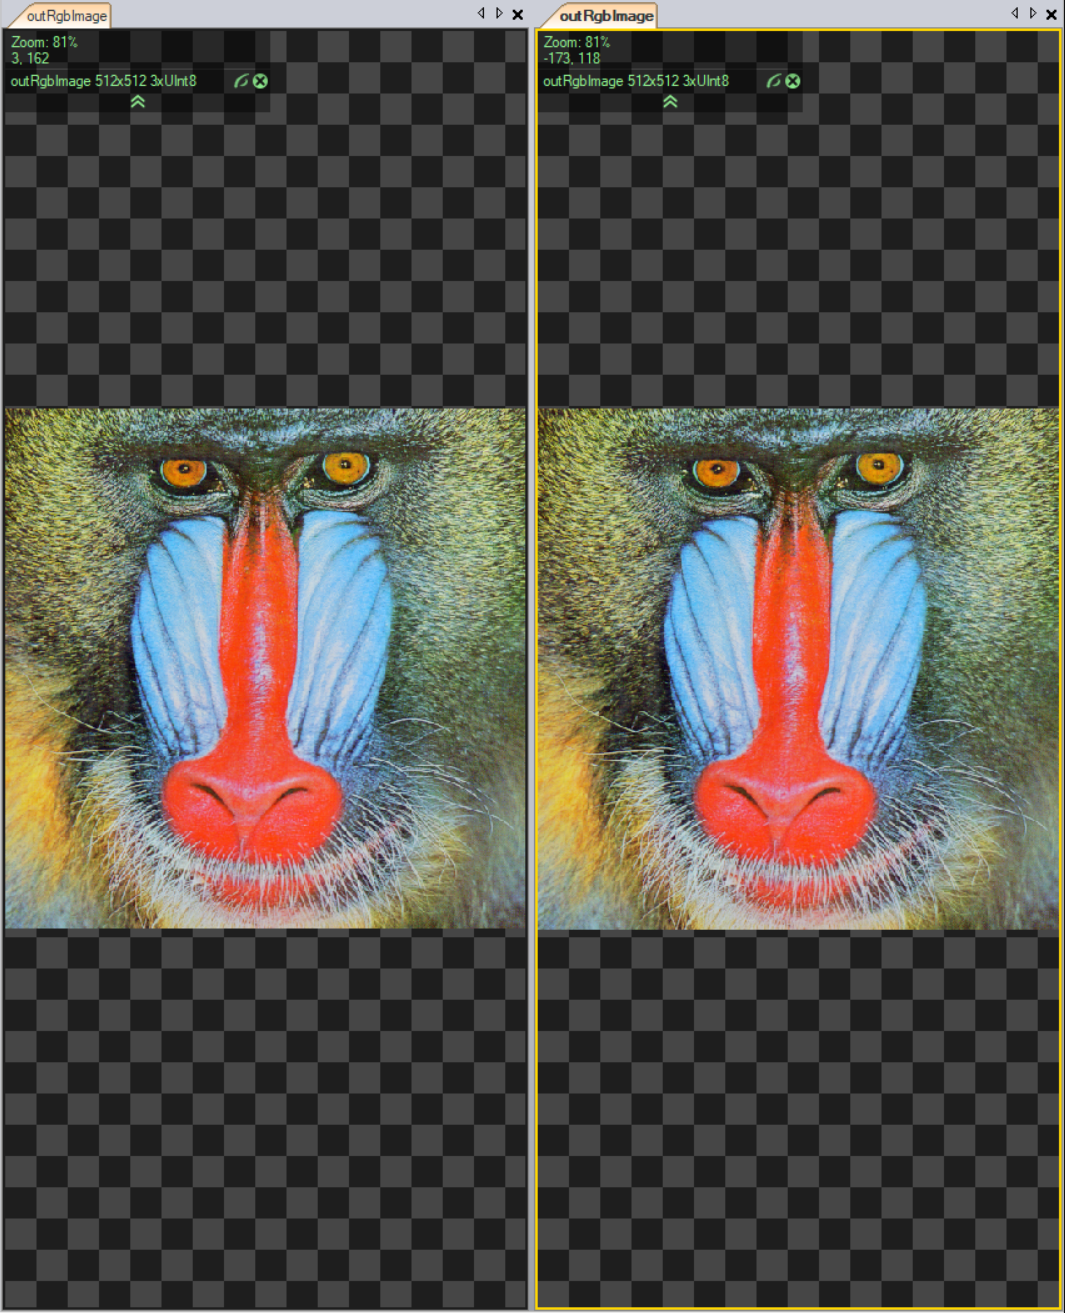
Vertical Split |
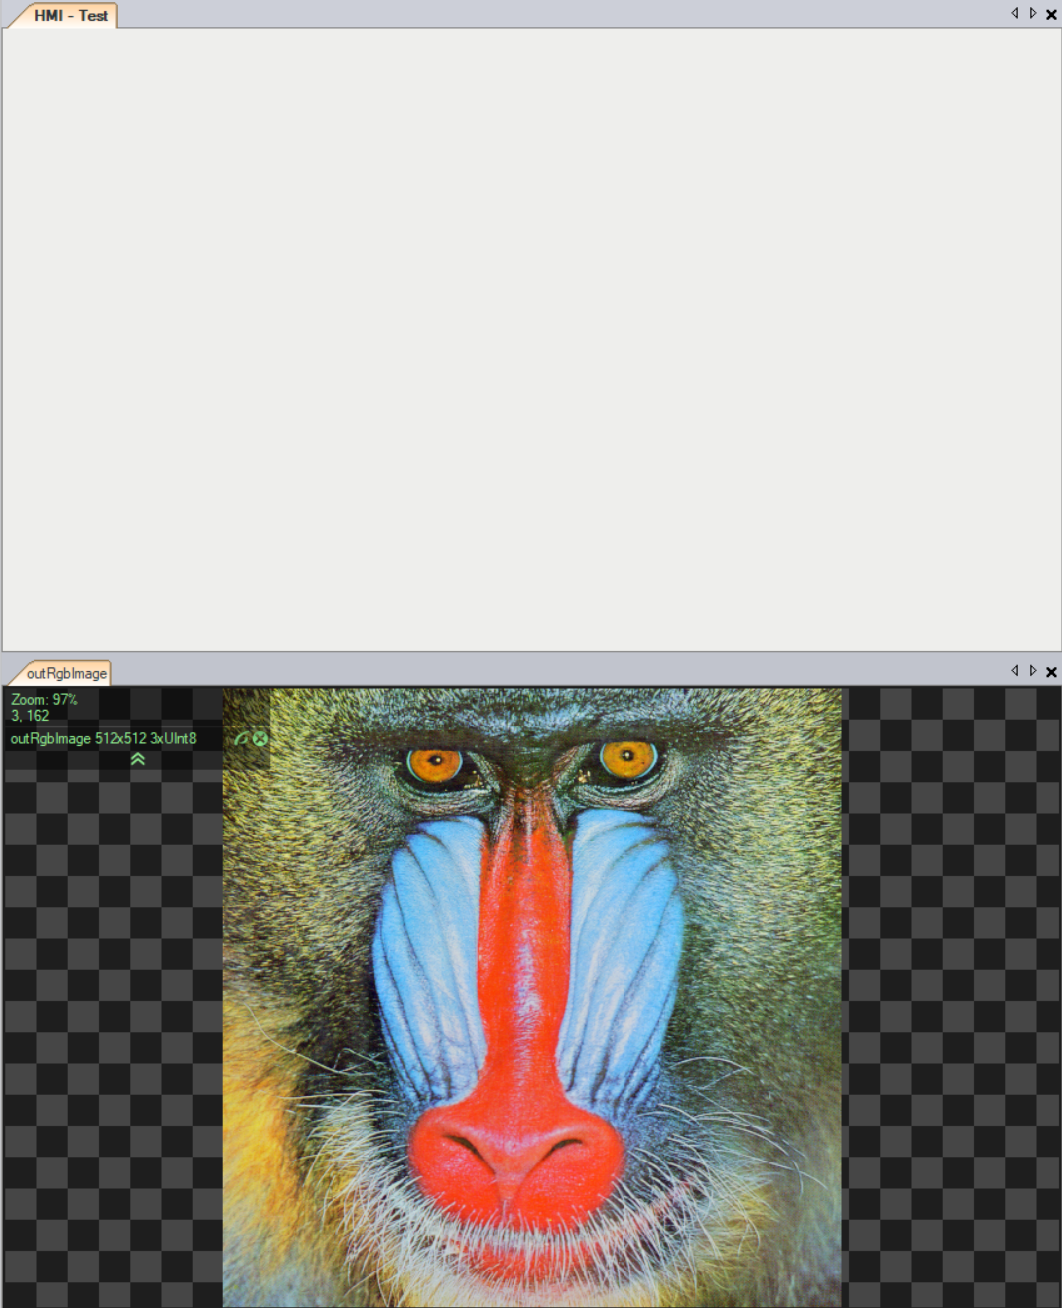
Add HMI on top of the Preview |
Another option that is at your disposal is docking. You can either double-click on the name of the preview or right-click and select Undock option. To restore the window to its previous preview simply right-click on the bar and select Dock option. Also, you can click and hold a Tab with the name of data preview and move it to another position. During that process the navigation pane appears and you can specify new appearance of the preview. 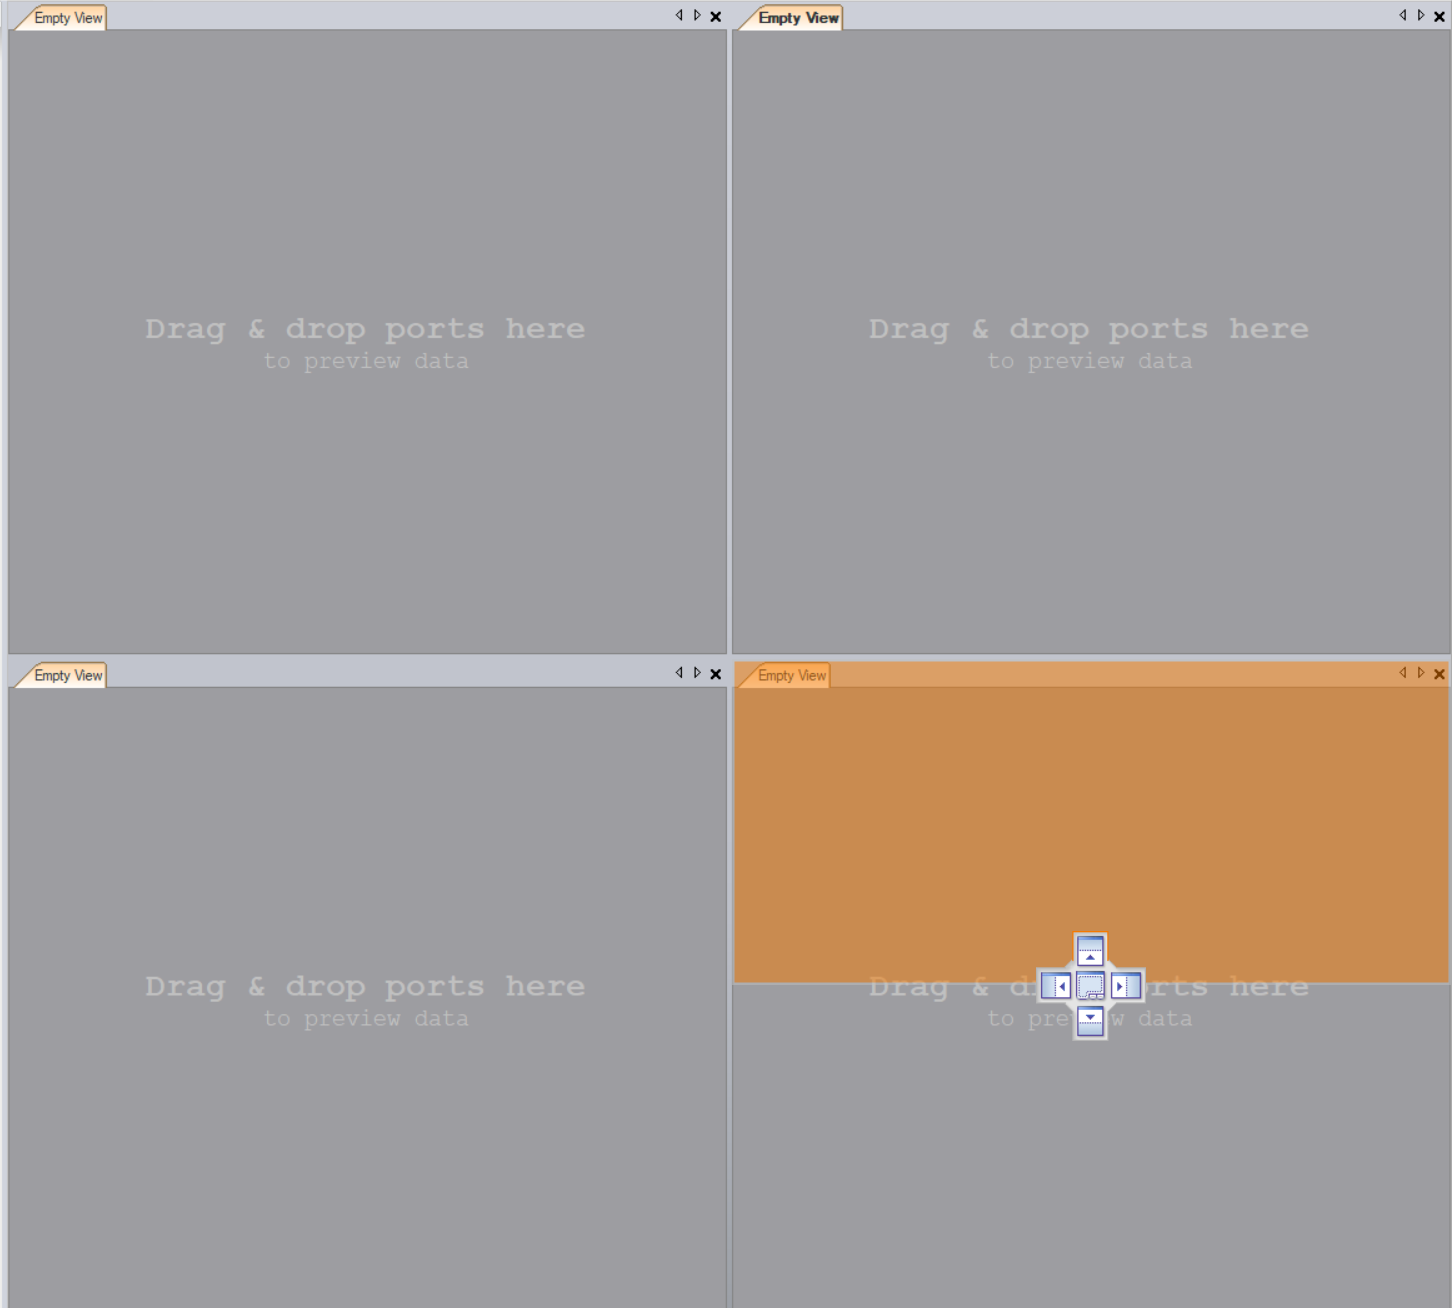
Layouts
It is possible to have up to three separate preview layouts arranged in different ways and switch between them when working on an algorithm. Additionally, Auto mode, which shows the most useful inputs and outputs of the currently active filter(tool), is available. All the above-mentioned features are available on the Toolbar: 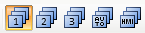 . There is also the HMI button that opens the standalone tab where you can design the user interface.
Image Tools
You gain access to the Image Tools after clicking on the image. It contains handy tools that will help you during the analysis of images. Note that they do not modify the image in the program, but rather help you set appropriate parameters and collect data necessary for the inspection, by influencing the preview.
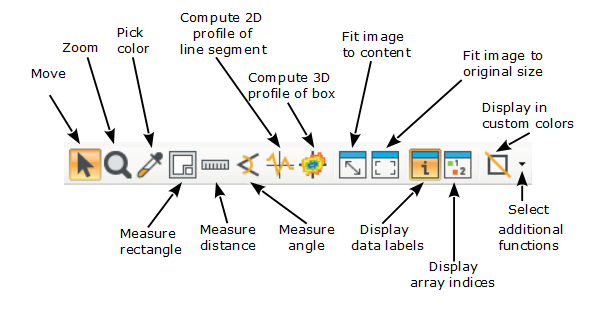
- Move and Zoom are purely for the navigation on the preview. It is possible to use the same functions with the scroll wheel of your mouse.
- The Pick Color tool is handy if you want to check the intensity in the image or RGB/HSV values before performing further operations on the image.
- The next three icons are all about the measurement. Measure rectangle allows to select a rectangle and measure its width and height. Measure distance returns the distance in pixels between two points on the image. Measure angle simply checks the angle defined by three points selected by user.
- Next, there are tools for 1D and 2D image profile analysis. After marking the segment or box on the image and you will receive a graph ready for a quick analysis.
- Following buttons are for fitting the image to the content and returning it to the original size.
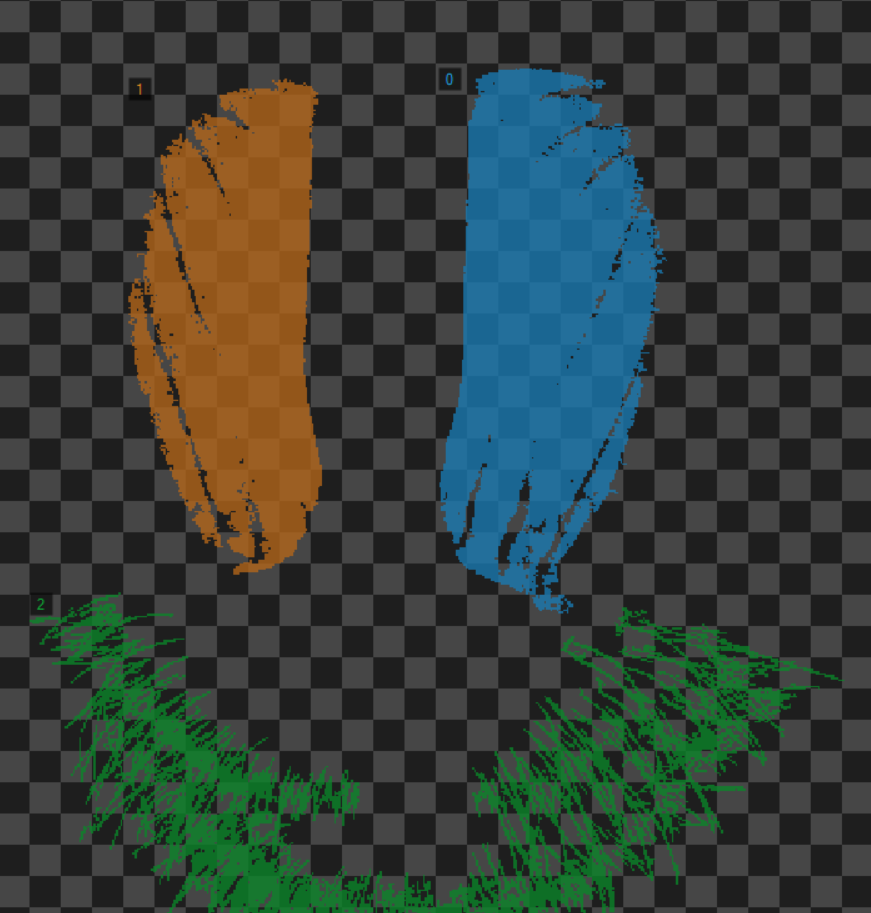
- Display data labels option allows you to see the labels on the objects and Display array indices shows the numbers on the image that correspond to the position of the features in the input array, as seen on the image below:
- Possible effects of the Display in custom colors tool are displayed below:

Original image |
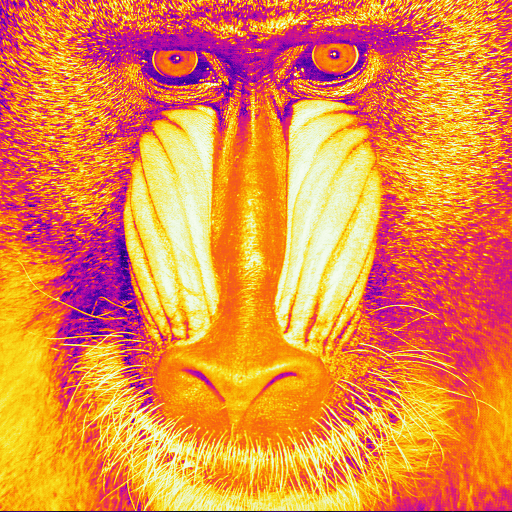
Colorized image |

Gamma Corrected image |
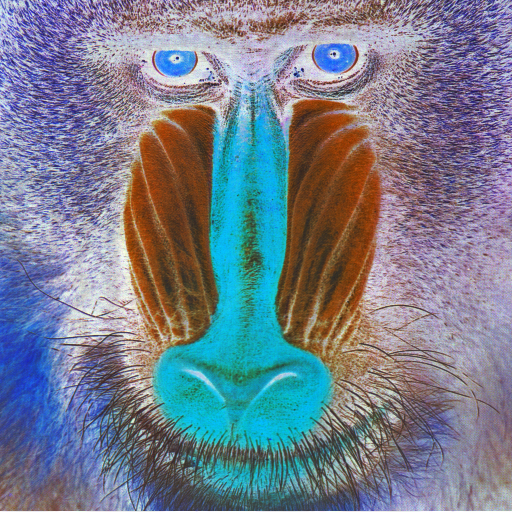
Negated image |
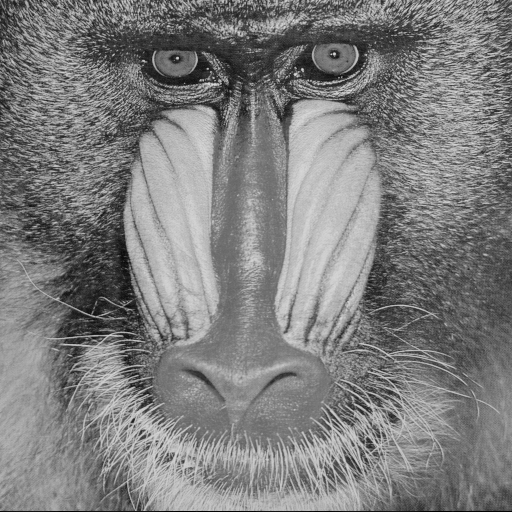
Average Channels of the image |

Normalized image |

Pixels divided by 16 (to quickly preview 12-bit images) |

Pixels Divided by 256 (to quickly preview 16-bit images) |
Image options on the preview
If you drop an image on the preview you will get access to additional options after right-clicking on it:
- Save Image As - saves the image with its original size and other parameters in the specified folder.
- Save View As - saves the current view of the image, with other elements (e.g. geometric primitives) located on it, in the specified folder.
- Copy View As Image - copies the current view of the image.
- Zoom to Fit - scales the image to the size of the preview window so it can fit in it.
- Zoom to Original size - returns the image to the original size.
- Show Information - turns on/off the information about the current preview.
- Show Array Indices - shows sorted numbers on the preview. You can only see the results of that button if it was dropped to the preview as an array.
Preview information
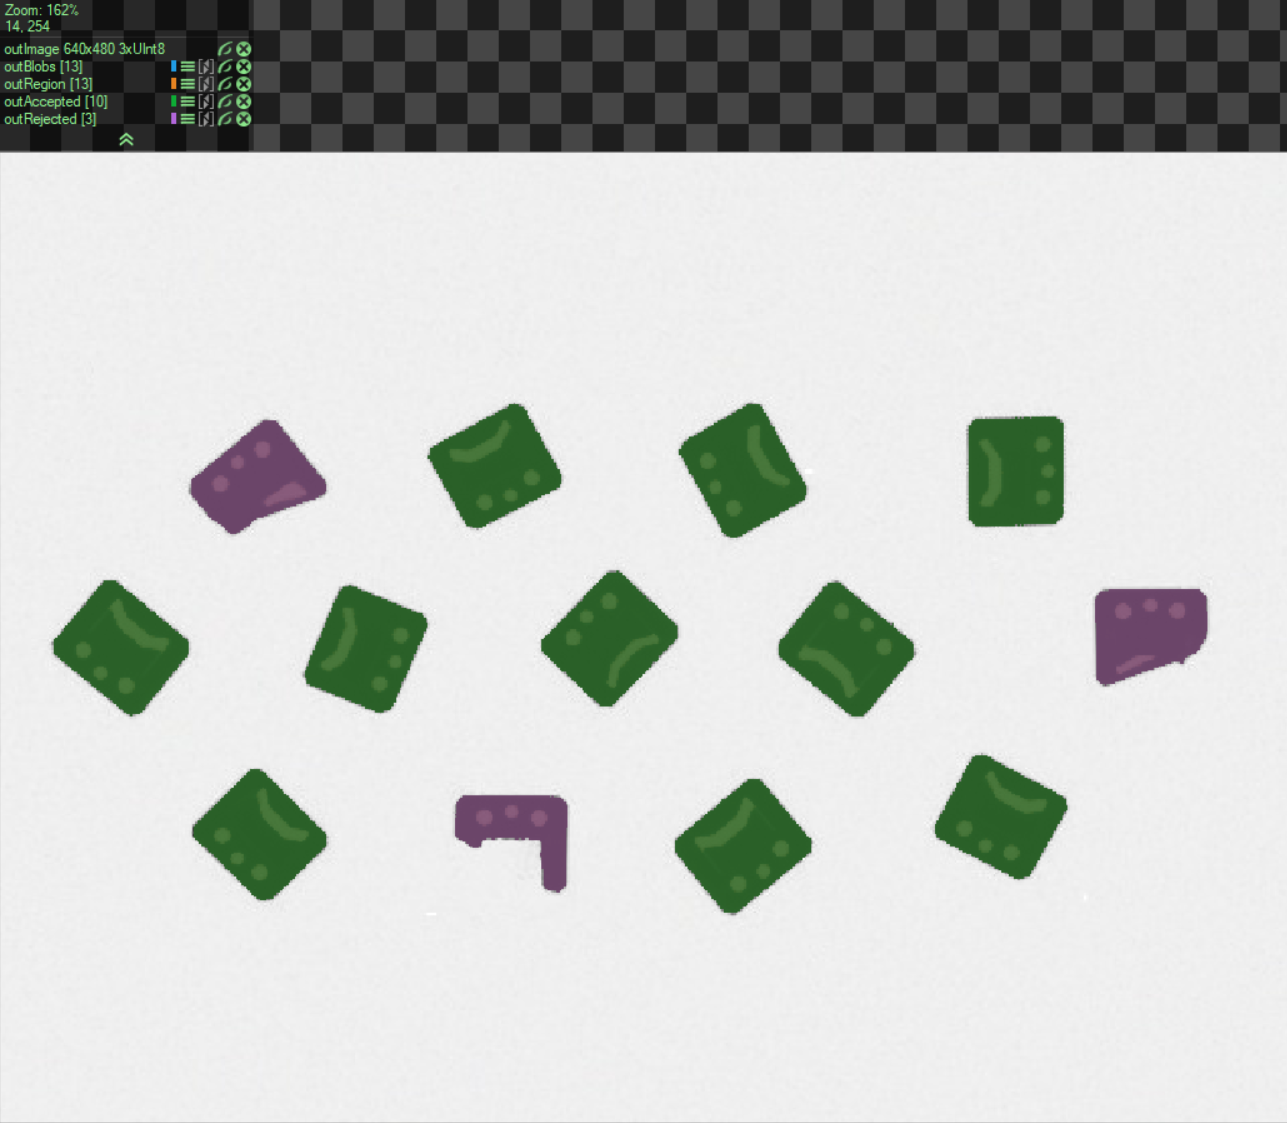 The green text at the top left corner of the preview contains the names of all the outputs and inputs that were dropped on it. They are always followed by additional information. In case of Image or Region it is usually its size. It is also possible to see a number in the brackets - [4]. It indicates the number of the elements of the array of data.
To the right of the names you may notice up to five buttons:
The green text at the top left corner of the preview contains the names of all the outputs and inputs that were dropped on it. They are always followed by additional information. In case of Image or Region it is usually its size. It is also possible to see a number in the brackets - [4]. It indicates the number of the elements of the array of data.
To the right of the names you may notice up to five buttons:
-
 - it tells you about the color the type of data is being displayed in. If you press it, you will be able to change its shade.
 -
 - by dragging and moving it up and down you can organize the data on the preview. Note that the color changes with the order of data, so it does not stay the same after being moved.
 -
 - it allows you to turn on and off the data from the preview without completely removing it.
 -
 - that button removes the data from the preview.
 -
 - it helps you navigate through elements of the arrays. If you turn it off, you will be able to see all the elements of the array on the preview at once. Turning it on switches the preview to show only one element and allows to iterate them one by one, however, it makes it impossible to see them all.
Adding comments
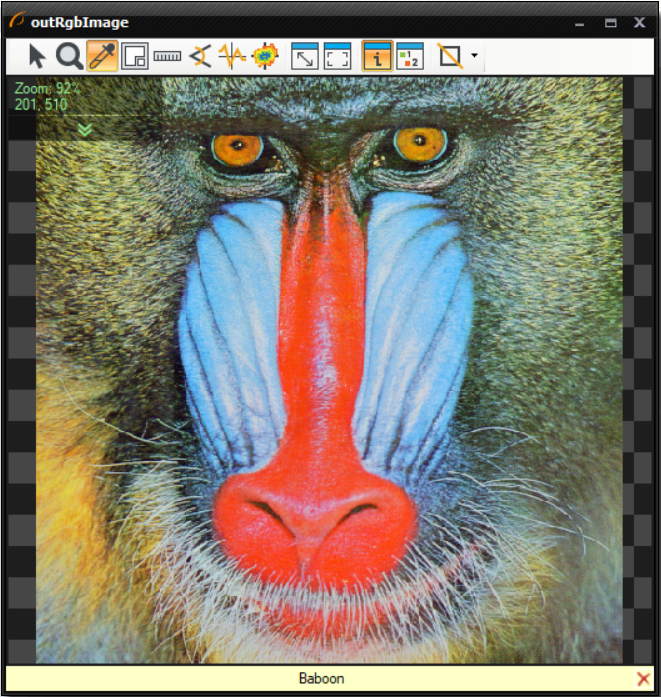
Adding a comment is a handful option that you can use on all your preview windows. To do so right-click on the name of the preview and choose Add Comment option. After that a yellow box at the bottom of the preview will appear. You will be able to write anything of your liking there, as in the image below:
Useful Settings
To change the quality of the previews you can enter Tools>>Settings>>Previews>>Preview Quality or Program>>Preview Quality. You will be able to choose from three different settings:
- Fast
- Balanced
- High Quality
Users may extract macrofilters in their program. By default that operation removes the previews of the filters that were enclosed. To prevent that you can access Tools>>Settings>>Editor>>Preserve port previews when extracting macrofilter.
For more details on the topic, please refer to a video tutorial on our YouTube channel:
Please note that previews of the 3D data are explained in a separate article: Working With 3D Data.
| Previous: Acquiring Images | Next: First Program: Simple Blob Analysis |