
You are here: Start » Tutorial Exercises » Bottle Inspector Part 2: Measuring Liquid Level
Bottle Inspector Part 2: Measuring Liquid Level
Aim:
Extend the "Bottle Inspector Part 1" program with the measurement of the liquid level for each bottle.
Input:
- A set of images of bottles.
- An array containing one coordinate system for each bottle.
Images are stored in the bottles directory.
Output:
Add a new filter that returns for each bottle:
- A point that represents the liquid level (as Point2D),
- A boolean value that shows if the liquid level is correct (as Bool).
Hints:
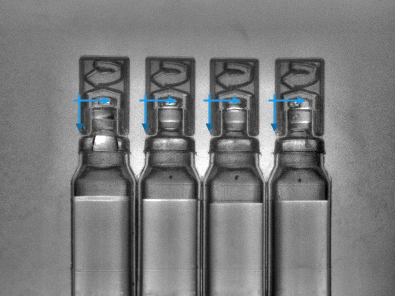
Start by creating a coordinate system for each bottle, so that we can define the liquid level measurement as a local operation that will be repeated in multiple coordinate systems. Use the CreateCoordinateSystemFromPoint filter with its input connected to the outStripes.Point1 output.
The pixel intensity profile along a line segment (oriented from top to bottom) crossing the liquid level looks like this:
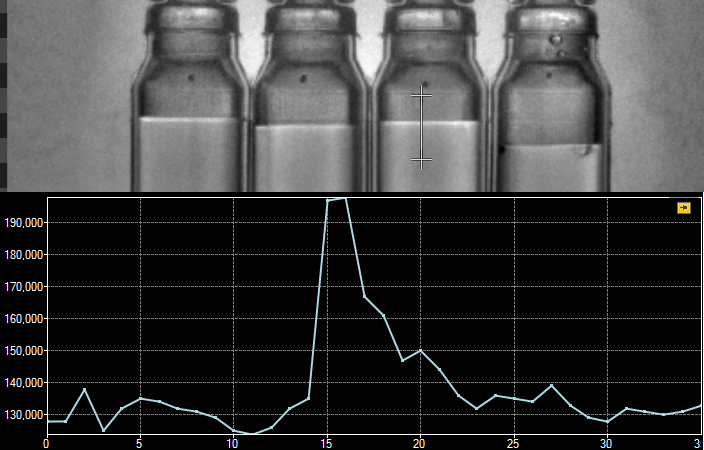
As we can see in the profile, there is a peak that represents a bright border between the liquid and the empty part of a bottle. Note that this might be counter-intuitive, but the liquid is actually not much brighter than the empty space above it. This peak in the profile starts with a dark-to-bright transition, or a rising edge. To find this edge, use the ScanSingleEdge filter.
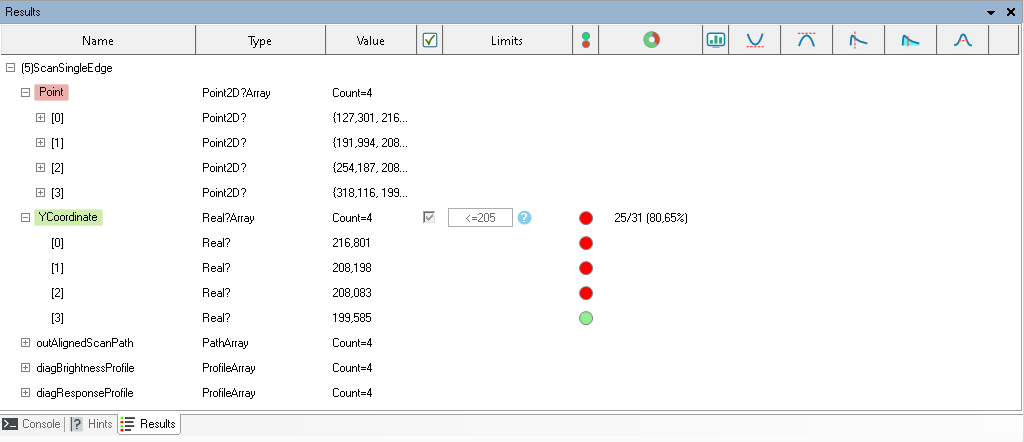
Since version 5.0, the new Results control (located in the panel at the bottom-right of the program window) allows you to continuously keep track of the values returned by the currently selected filter(s) as well as perform quick real-time Pass/Fail analyses based on the criterion described within the Limits parser. If this control is not visible, you may enable it through View » Results.
In the image below, you can see that at the ScanSingleEdge filter, 25 out of 31 (or 80,65%) bottles detected in the images during the inspection exhibited the Y coordinate value lower or equal to 205. Hover your cursor over the question mark in order to find out what other kinds of criteria can be parsed into the Limits box.
Solution (AVS):
Start with the program created in the "Bottle Inspector Part 1" tutorial.
-
Add the SegmentCenter filter and connect the outStripes output form the ScanMultipleStripes with the inSegment input.
-
Create a coordinate system from outCenterPoint using the CreateCoordinateSystemFromPoint filter.
-
Add the ScanSingleEdge filter with:
- the inImage input connected with the input image.
- the inScanPathAlignment input connected with the local coordinate system.
This filter will be executed in array mode.
-
Define a scan path:
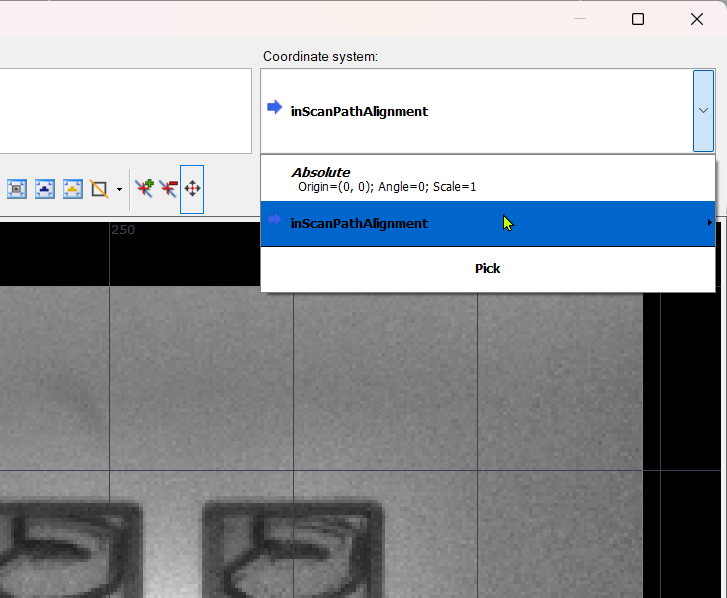
- Open the Path editor on the inScanPath input.
-
Create a scan path using a coordinate system from the inScanPathAlignment input. It is shown in the picture below.
-
Expose the Point Y property of the outPoint output of the ScanSingleEdge filter.
-
Click on the ScanSingleEdge filter and go to the Results control (Results control was described in the Hints section of this tutorial). Check in Y Coordinate and enter <=205 in the Limits column.
-
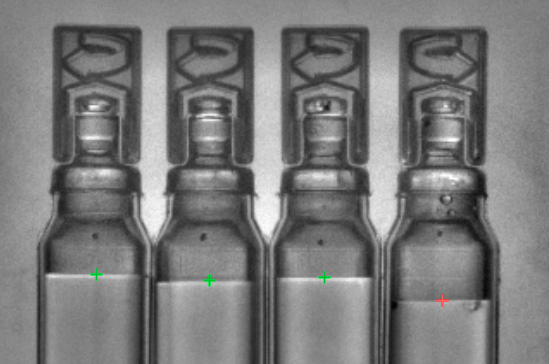
(Optional) Use the DrawPoints_TwoColors filter to draw obtained results on the image.
Macrofilter Main performs a bottle inspection.

Further Readings
- 1D Edge Detection - The article explaining how edge detection filters work.
- Formulas - Detailed information about using formulas.
- Local Coordinate Systems - This article describes basic concept of using the coordinate systems.