
You are here: Start » Web HMI » Web HMI Controls » BarChart
BarChart
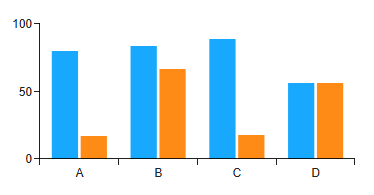
Represents a control that displays data in a bar chart format.
Properties
| BarGapRatio |
|
Defines the gap between bars within a category as a ratio of the gap size to the size of the bar. |
| CategoryGapRatio |
|
Defines the gap between categories as a ratio of the gap size to the size of the bars within the category. |
| CategoryLabels |

|
Defines the labels for groups of bars. |
| ColorMap |
|
Defines the color mapping strategy for the bars. |
| DataSource |
|
Defines the data source for the bar chart as an array of values or simple structures. If an array of structures is connected, each structure field represents a series. |
| Height |
|
Defines the CSS height of the control. |
| HideLegend |
|
Defines whether to hide the legend. |
| HideTooltip |
|
Defines whether to hide the tooltip that appears when hovering over the bars. |
| InitialIsEnabled |
|
Defines the initial enabled state of the component that is used before the first value is set through the connection. |
| InitialIsVisible |
|
Defines the initial visibility of the component that is used before the first value is set through the connection. |
| IsEnabled |
|
Defines the enabled state of the component. |
| IsVisible |
|
Defines the visibility of the component. |
| Layout |
|
Defines the bar orientation within the chart. |
| LegendDirection |
|
Defines the direction of the legend layout. |
| LegendHorizontalAlignment |
|
Defines the horizontal alignment of the legend. |
| LegendVerticalAlignment |
|
Defines the vertical alignment of the legend. |
| Margin |
|
Defines the CSS margin of the control. |
| Max |
|
Defines the maximum value of the chart's value axis. If not set, the maximum is determined automatically. |
| MaxHeight |
|
Defines the CSS max-height of the control. |
| MaxWidth |
|
Defines the CSS max-width of the control. |
| Min |
|
Defines the minimum value of the chart's value axis. If not set, the minimum is determined automatically. |
| MinHeight |
|
Defines the CSS min-height of the control. |
| MinWidth |
|
Defines the CSS min-width of the control. |
| Name |
|
Defines the control name that identifies the control in the program and in the XAML. The name must be unique within the parent endpoint. |
| SeriesLabels |
|
Defines the labels for series. |
| ShowBarBackground |
|
Defines whether to show a background for the bars, indicating the maximum value of the chart. |
| ShowLabels |
|
Defines whether to show values on the bars. |
| ValueFormat |
|
Defines the format of the values displayed in the tooltip and on the labels. The format is compatible with the standard .NET numeric format strings. |
| Width |
|
Defines the CSS width of the control. |
| XTitle |
|
Defines the title of the X axis. |
| YAxisWidth |
|
Defines the width of the Y axis in pixels. If not set, the width is adjusted automatically. |
| YTitle |
|
Defines the title of the Y axis. |
