
You are here: Start » User Interface » Analysing Filter Performance
Analysing Filter Performance
The Program Statistics window contains information about the time profile of the selected macrofilter. This is very important as real vision algorithms need to be very fast. However, before starting program optimization we must know what needs to be optimized, so that later we optimize the right thing. Here is how the required information is presented:
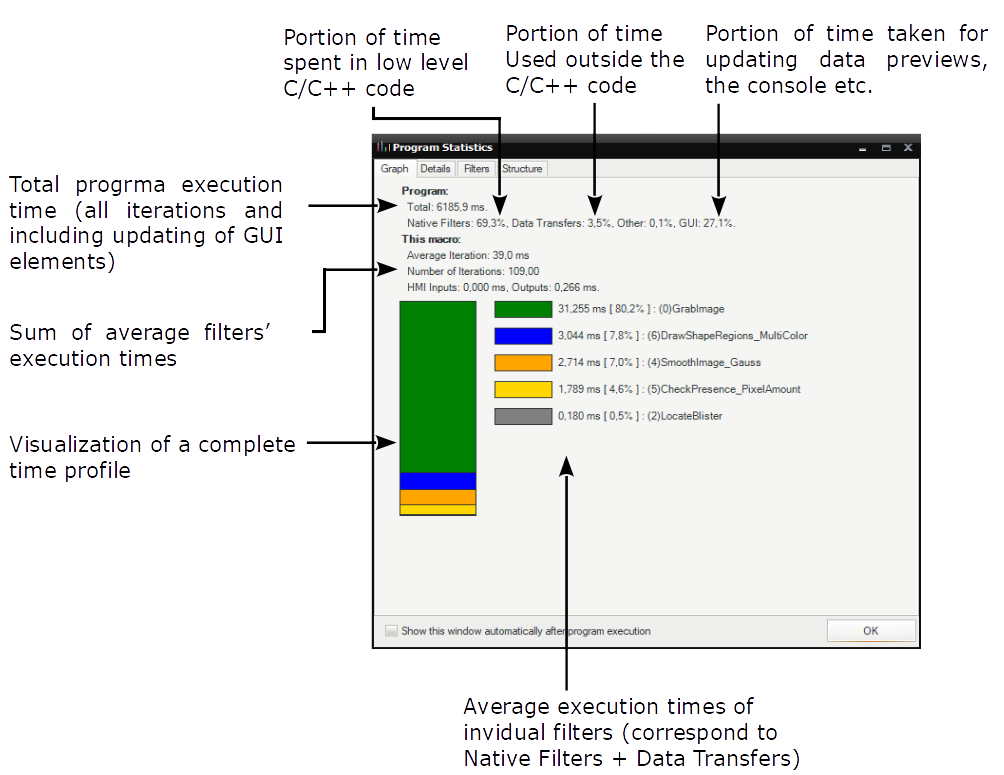
As can be seen on the above illustration, program execution time is affected by several different factors. The most important is the "Native Filters" time, which corresponds to the core data processing tools. Additional time is consumed by "Data Transfers", which is related to everything that happens on connections between filters – this encompasses automatic conversions as well as packing and unpacking arrays on array and singleton connections. Another statistic called "Other" is related to the virtual machine that executes the program. If it value is significant, then C++ code generation might be worth considering. The last element, "GUI", corresponds to visualization of data and program execution progress. You can expect that this part is related only to the development environment and can possibly be reduced down to zero in the runtime environment.
Remarks:
- In practice, performance statistics may vary significantly in consecutive program executions. It is advisable to run the program several times and check if the statistics are coherent. It might also be useful to add the EnumerateIntegers filter to your program to force a loop and collect performance statistics not from one, but from many program iterations.
- Turn off the diagnostic mode when testing performance.
- Data Preview Panels, animations in the Program Editor and even the Console Window can affect performance in Adaptive Vision Studio. Choose Program » Previews Update Mode » Disable Visualization to test performance with minimal influence of the graphical environment. (Do not be surprised however that nothing is visible then).
- Even with all windows closed there are some background threads that affect performance. Performance may still be higher when you run the program with the Executor (runtime) application.
- Please note that the first program iteration might be slower. This is due to the fact that in the first iteration memory buffers are allocated, filters are initialized, communication with external devices is established etc.
See also: Optimizing Image Analysis for Speed.
| Previous: Creating Text Recognition Models | Next: Seeing More in the Diagnostic Mode |