
You are here: Start » User Interface » Creating Deep Learning Model
Creating Deep Learning Model
Contents:
- Introduction
- Requirements
- Workflow
- Detecting Anomalies
- Classifying features
Introduction
Deep Learning Editor allows the user to create DeepModel objects for Deep Learning tasks.
Currently two major deep learning tools are available:
- Anomalies Detection - technique which enables the user to find defects based on the provided samples. The user only has to mark which images are good and which are bad.
- Features Classification - technique in which the user has to select which kind of objects should be found on the provided samples.
Requirements
- Deep Learning license is required to use Deep Learning Editor and filters.
- Deep Learning Service must be up and running to perform model training.
Workflow
Deep Learning model preparation process is split into the following steps:
- Loading images - first load the input images,
- Marking good and bad samples - indicate features or attach labels for each training image,
- Reducing Region of Interest - select area of image on which training should be done,
- Setting model parameters - select parameters with which training should be done,
- Training and analyzing results.
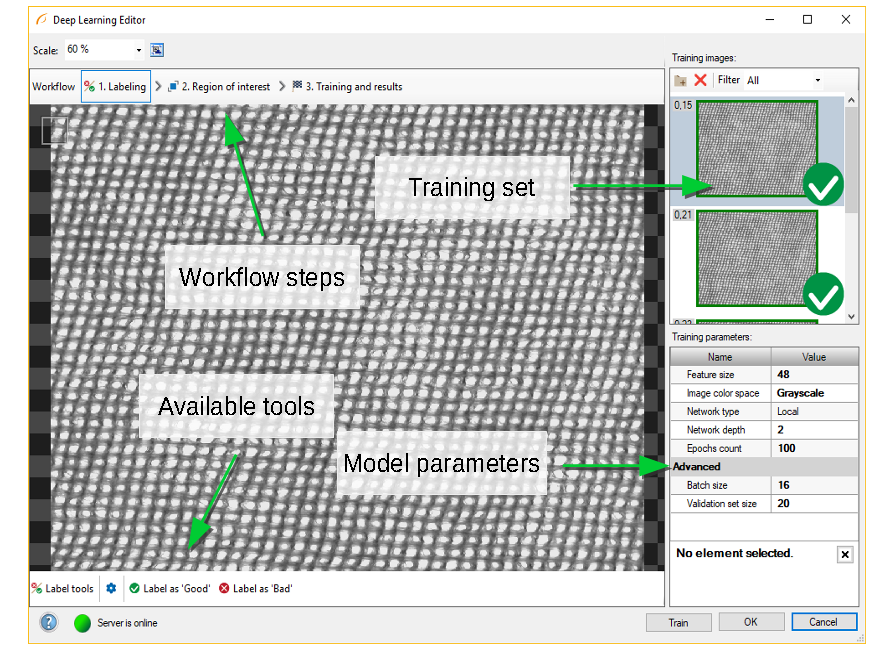
Editor overview.
Detecting Anomalies
In this algorithm variant, the user only has to mark which images contain correct cases (good) or incorrect ones (bad).
1. Marking good and bad samples
Use Label as 'Good' or Label as 'Bad' buttons to label each image in the training set. Green and red icons on the right side of the training images indicate to which set an image was assigned.
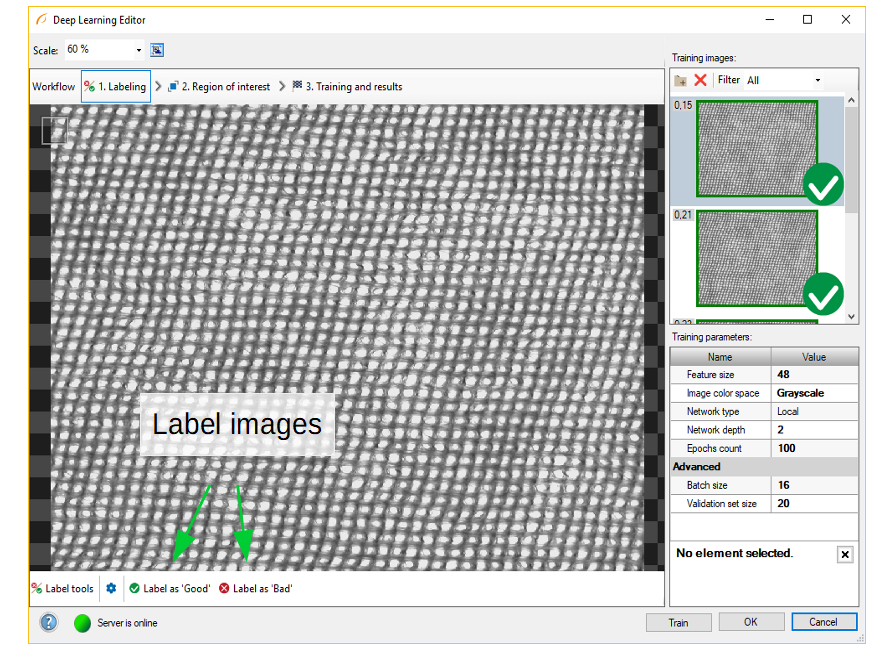
Labeled images in Deep Learning Editor
2. Configuring additional samples augmentation
Additional sample augmentation can be turned on in case when only few samples are available. For example the user can add additional changes in color intensity to prepare the model for different lighting conditions.
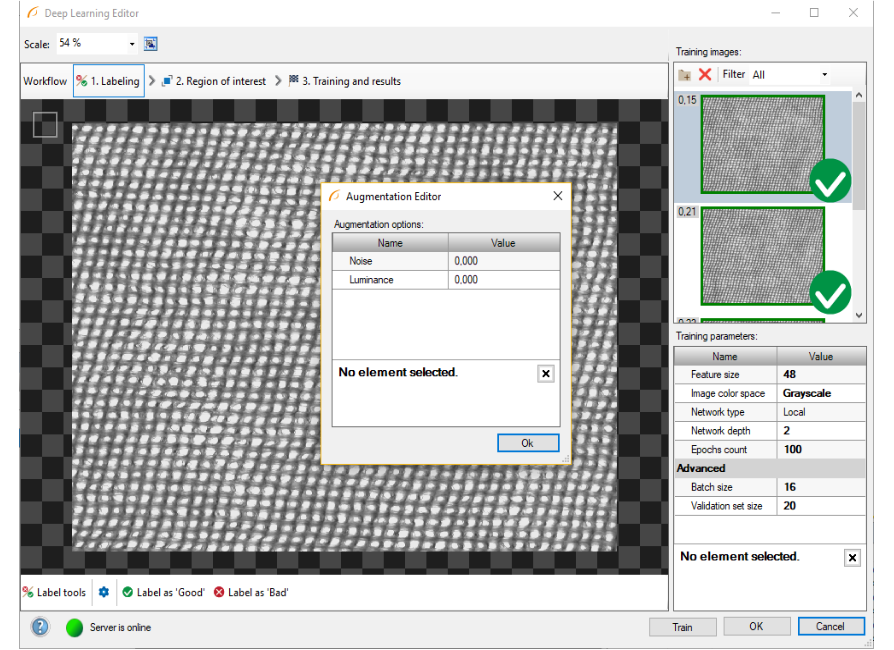
Opened augmentation editor.
3. Reducing Region of Interest
Reduce region of interest to focus only on the important part of the image. Reducing region of interest will speed up the training and classification.
To get the best classification results, use the same region of interest for training and classification.
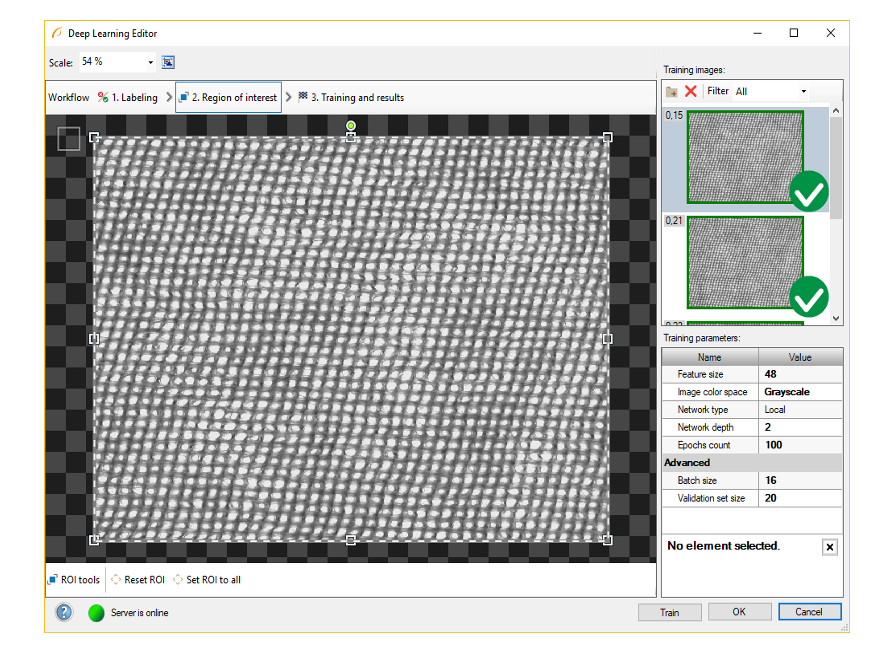
By default region of interest contains the whole image.
4. Performing training
During training, two series are visible: training error and validation error. Both charts should have a similar pattern.
More detailed information is displayed below the chart:
- Current training statistics (training and validation),
- number of processed samples (depends on the number of images and tile size),
- estimated training time.
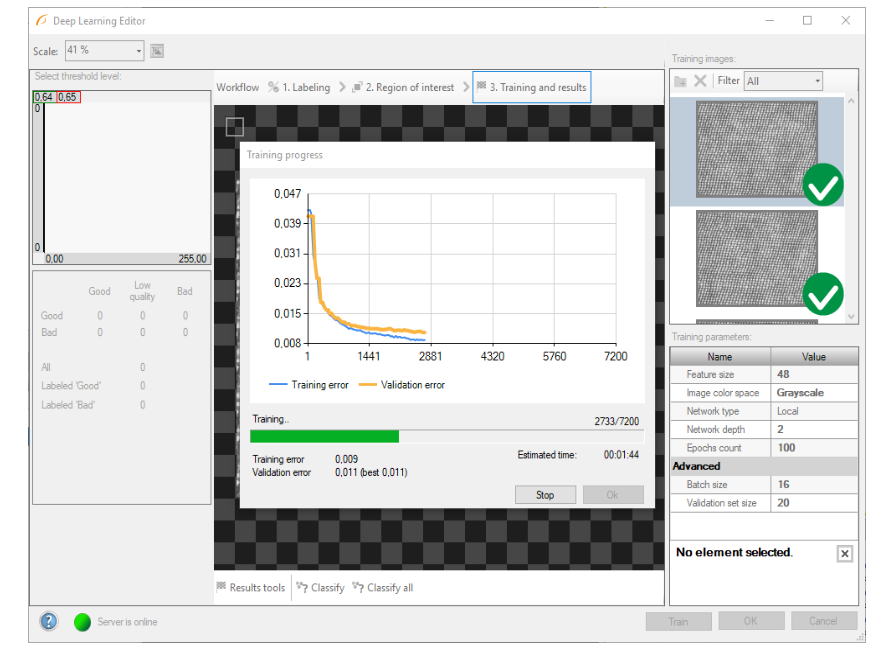
Training process can take a longer time. During this time training can be canceled. Model with the best validation score will be saved.
5. Analyzing results
The window shows a histogram of sample scores and a heatmap of found defects. Left column contains histogram of scores computed for each image in the training set. Additional statistics are displayed below the histogram.
Classify and Classify All buttons can be used to perform image classification. It can be useful after adding new images to the training set or after changing the area of interest.
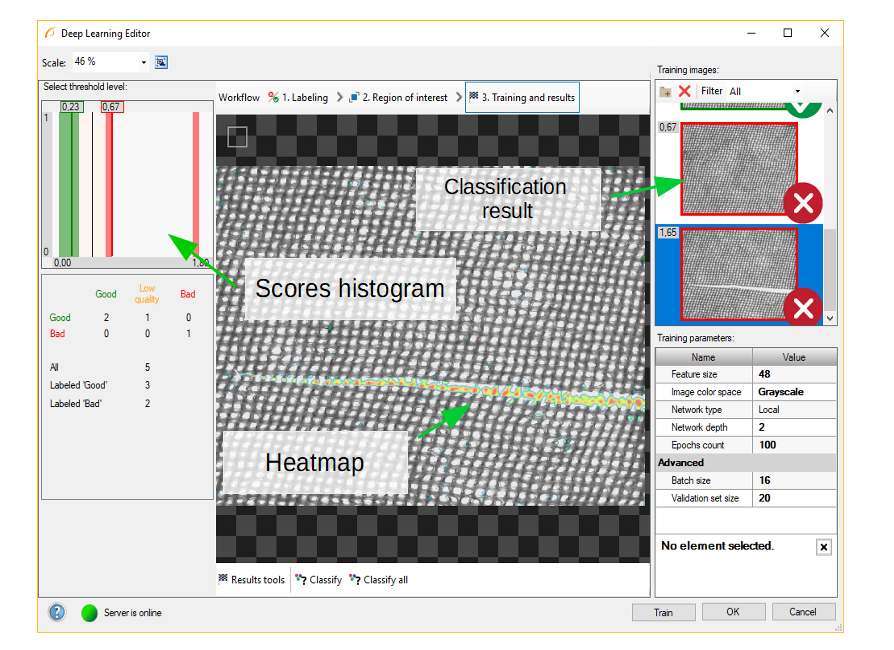
After training, two border values are computed:
- Maximum good sample score (T1) - all values from 0 to T1 are classified as good.
- Minimum bad sample score (T2) - all values greater than T2 are classified as bad.
All scores between T1 and T2 are marked as "low-quality" scores. Classification results in this range are uncertain and may not be correct. Classification filters contain additional output outIsConfident which determines the values which are not in the T1-T2 range.
In the top left corner of the editor, a small rectangle visualizes the selected tile size.
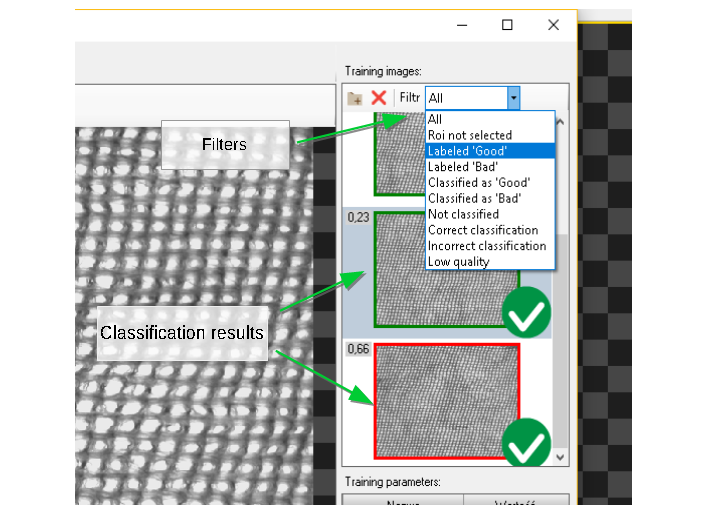
After classification, additional training set images filter can be applied.
Classifying features
In this algorithm variant, the user has to define each feature class and then mark features on each image in the training set. This technique is used to find object defects like scratches or color changes, and for detecting image parts trained on a selected pattern.
This technique is a very good solution for problems which are too complex for classical vision algorithms.
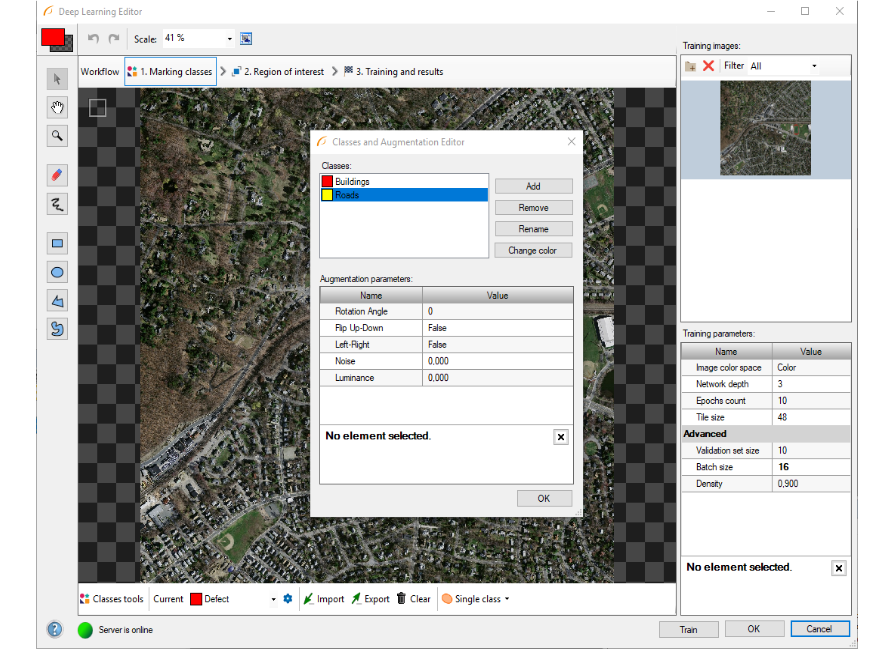
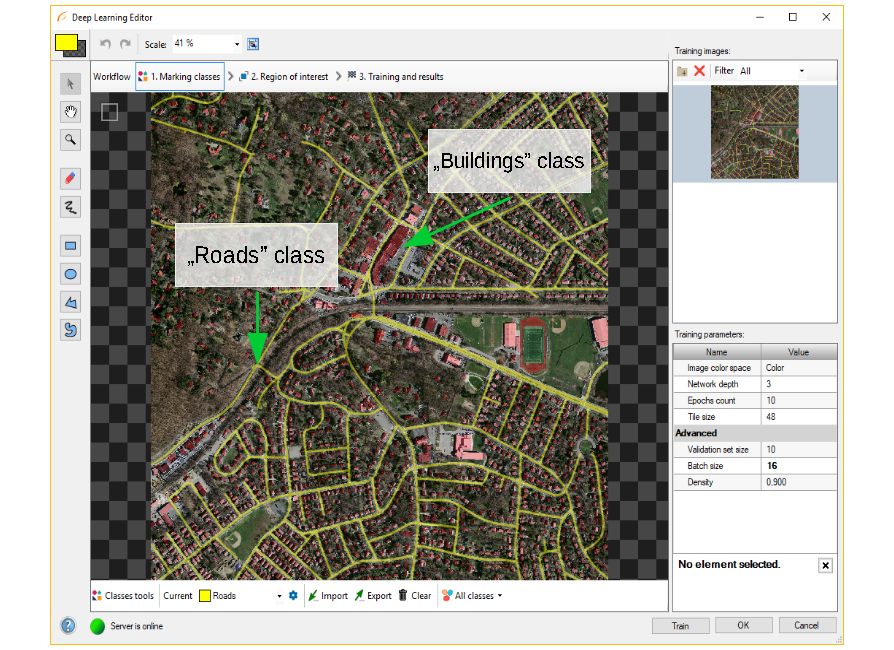
1. Defining feature classes
The window is split into two parts: classes management and augmentation setup.
To manage classes, Add, Remove or Rename buttons can be used. To customize appearance, color of each class can be changed using Change Color button.
Additional samples augmentation can be turned on at the bottom of the window. It is very useful when number of feature pixels is much smaller than the background image pixels. Additional changes in sample brightness can be useful in preparing a more robust model working with different lighting conditions.
2. Defining feature classes
Use drawing tool to mark features on the input images. Tools such as Brush or Rectangle can be used for selecting features.
In addition, class masks can be imported from external files. The image mask should have the same size as the selected image in the input set. When importing an image mask, all non-black pixels will be included in the current mask.
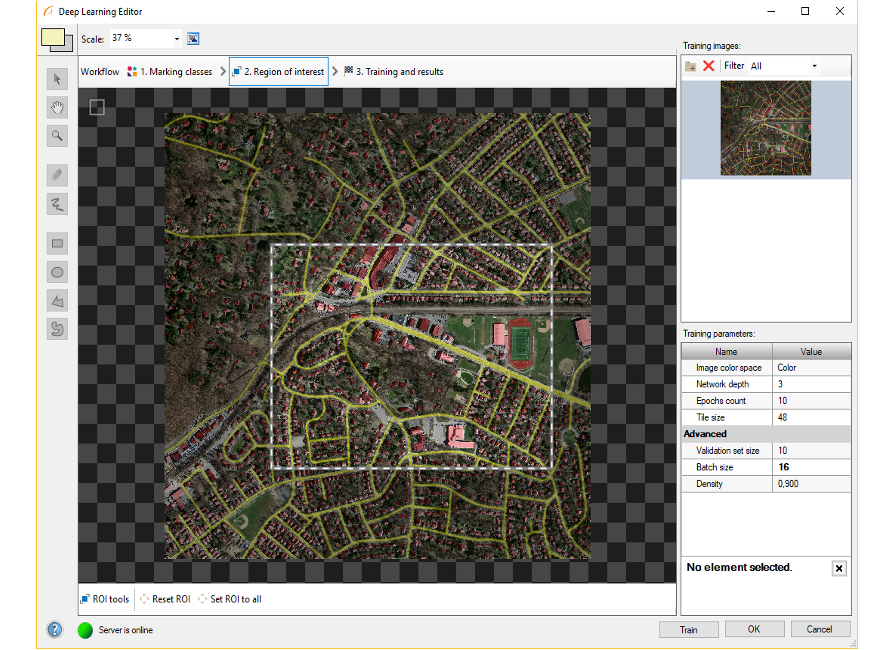
3. Reducing region of interest
The user can reduce input image size to speed up the training process. In many cases, number of features on an image is very large and most of them are the same. In such case region of interest also can be reduced.
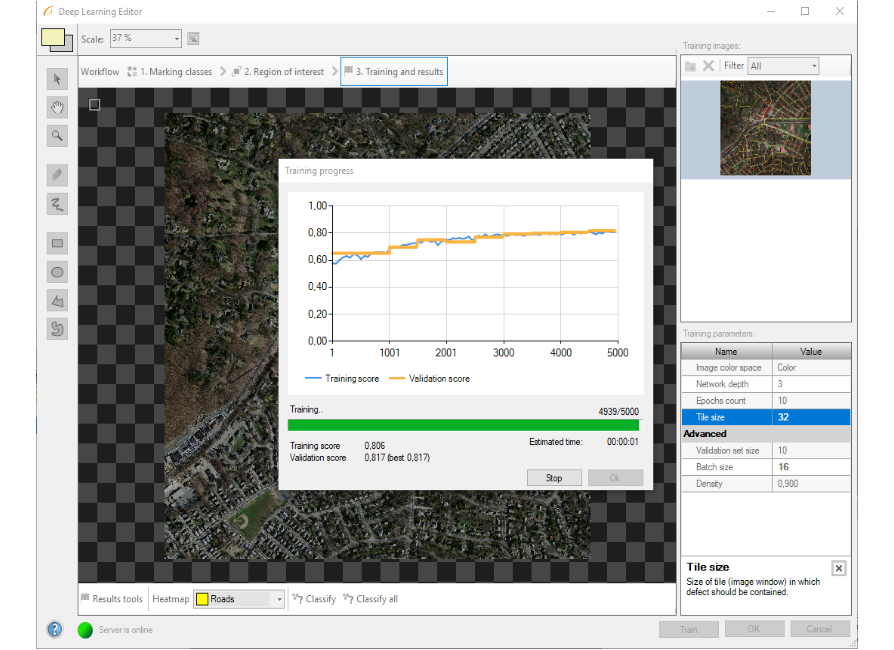
4. Model training
The chart contains two series: training and validation score. Score value is between 0 and 1. Higher score value results in better feature classification.
4. Result analysis
Image scores (heatmaps) are presented in blue-yellow-red colors palette after classification. The color represents the probability of the element belonging to the currently selected feature class.
Classify and Classify All buttons can be used to perform image classification. It can be useful after adding new images to the training set or after changing the area of interest.
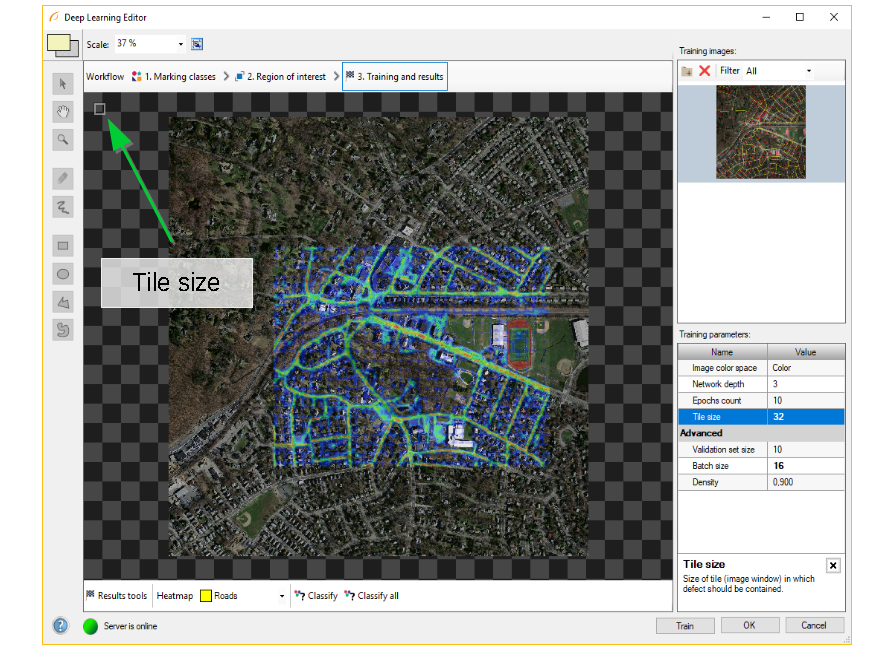
Image after classification performed using reduced region of interest.
In the top left corner of the editor, a small rectangle visualizes the selected tile size.
See also:
- Machine Vision Guide: Deep Learning - Deep Learning technique overview,
- Deep Learning Service Configuration - installation and configuration of deep learning service.
| Previous: Managing Projects with Project Explorer | Next: Creating User Filters |