You are here: Start » Tutorial Exercises » Generating Plots (formulas)
Generating Plots (formulas)
Aim
Create an application that creates plots for following mathematical functions:
- Linear function: y=x
- Sine function: y=sin(180 * x)
- Quadratic function: y=x * x
- Threshold function that returns value 0.5 * sin(x * 360) if x is smaller than 0.5 in other case returns 0.
Function arguments should be provided as Real.
Input
The defined parameter range.
Output
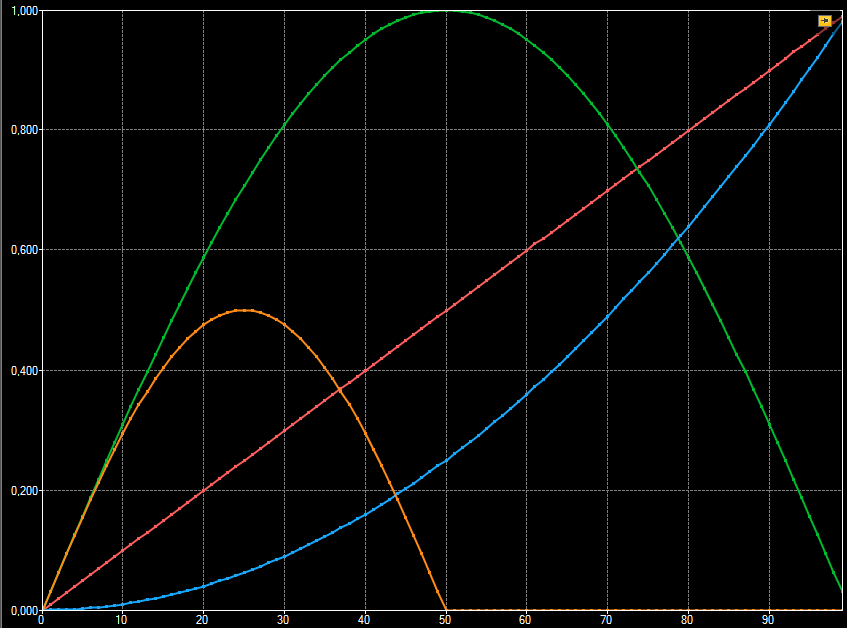
Created plots should be presented using single preview windows.
Hints
To calculate function values Formulas should be used.
To create series of real values in specified range CreateRealSequence filter should be used.
To create profile that can be used to present function's plot use RealArrayToProfile filter.
Solution (AVS)
-
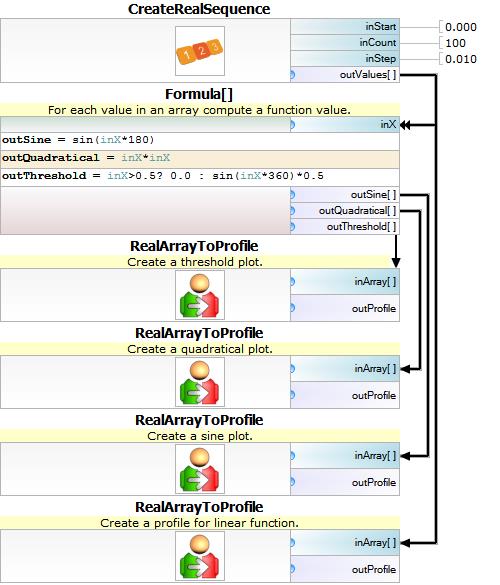
Add CreateRealSequence filter to the project and set inCount to 1000 and inStep to 0.01. This filter creates an array of real values, that should be used as function arguments.
-
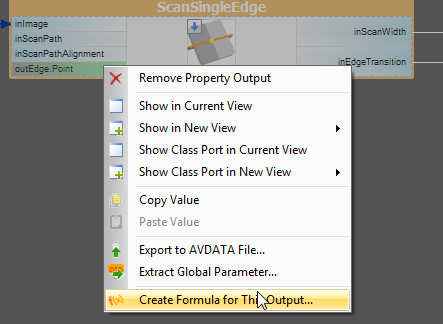
Add an Empty Formula to the program and connect the result of CreateRealSequence to the new input inX of type Real. Formula can be easily created by right clicking on the Program Editor Window.
-
To calculate linear function value create a new formula output:
outLinear = inX.
-
To calculate sine function create a new formula output:
outSine = sin(inX * 180).
-
To calculate quadratical function create another formula output:
outQuadratical = inX*inX.
-
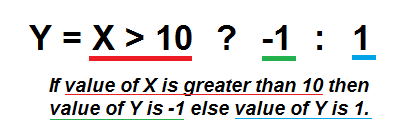
Calculation of the threshold function is more complicated. At the beginning inX should be check if its value is greater than 0.5. To do this operator ?: should be used. The image below shows how to use this operator.
-
Add four RealArrayToProfile filters and connect to their inputs outputs from the formula.
-
Show output profiles in a single preview window.
Macrofilter Main is using formula to plot desired functions.