

You are here: Start » Extensibility » Debugging User Filters
Debugging User Filters
Debugging User Filters with Adaptive Vision Studio Running
To debug your user filters, follow the instructions below:
- If the Visual Studio solution of your user filter library is not opened, open it manually. For global user filters it is typically located in My Documents\Adaptive Vision Studio Professional\Sources\LibraryName, but can be located in any other location that you have chosen while creating the library. For local user filters, you can check the location of the solution file in the Project Explorer task pane.
- Make sure that Adaptive Vision Studio is not running.
- Select Debug configuration.
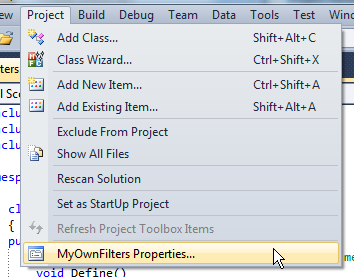
- Go to the project properties:
- Go to Debugging section:
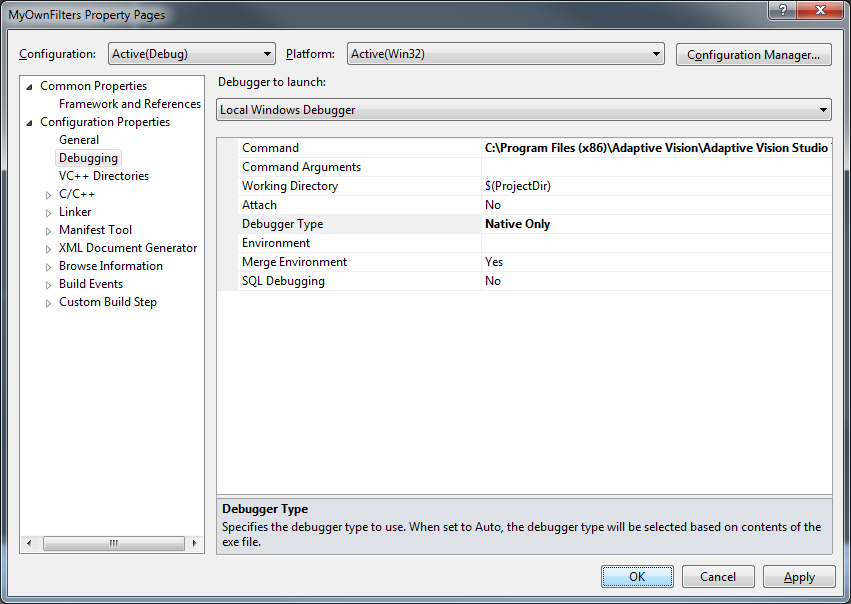
- Set Command to the executable of Adaptive Vision Studio.
- Set Debugger Type to Native Only.
- Set a breakpoint in your code.
- Launch debugging by clicking F5.
- Have your filter executed in Adaptive Vision Studio. At this point it should get you into the debugging session.
Debugging Tips
-
User filters have access to the Console window of Adaptive Vision Studio. It can be helpful during debugging user filters. To write on the Console, please use one of the functions below:
- bool LogInfo (const atl::String& message);
- bool LogWarning(const atl::String& message);
- bool LogError (const atl::String& message);
- To write messages on the Output window of the Microsoft Visual Studio, please use standard OutputDebugString function (declared in Windows.h).
| Previous: Creating User Filters | Next: Creating User Types |