
You are here: Start » Tutorial Exercises » Generating Plots (formulas)
Generating Plots (formulas)
Aim
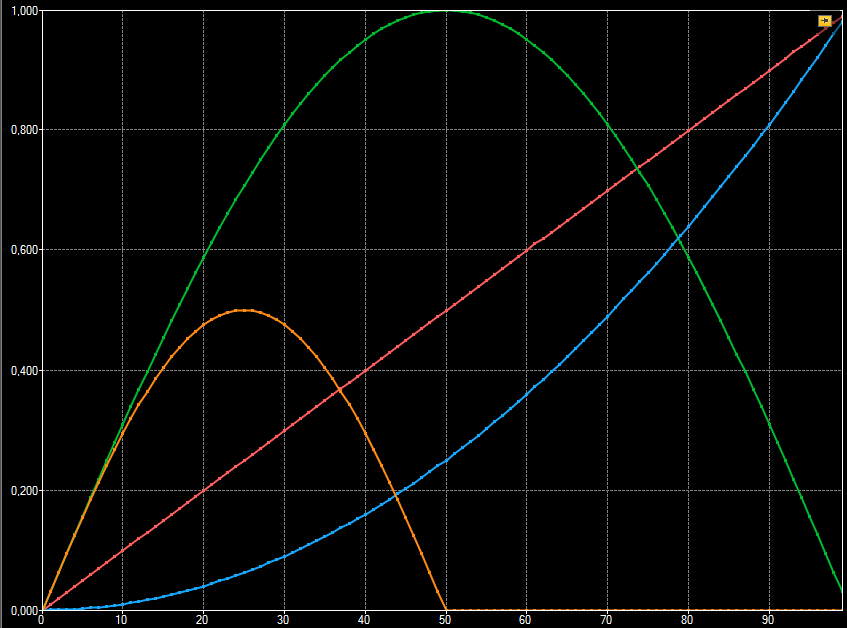
Create an application that creates plots for the following mathematical functions:
- Linear function: y=x
- Sine function: y=sin(180 * x)
- Quadratic function: y=x * x
- Threshold function that returns value 0.5 * sin(x * 360) if x is smaller than 0.5, otherwise it returns 0.
Function arguments should be provided as Real values.
Input
The defined parameter range.
Output
Created plots should be presented using a single preview window.
Hints
Use Formulas to calculate function values.
CreateRealSequence filter should be used o create series of real values in a specified range.
Use RealArrayToProfile filter to create a profile that can be used to present a function's plot.
Solution (AVS)
-
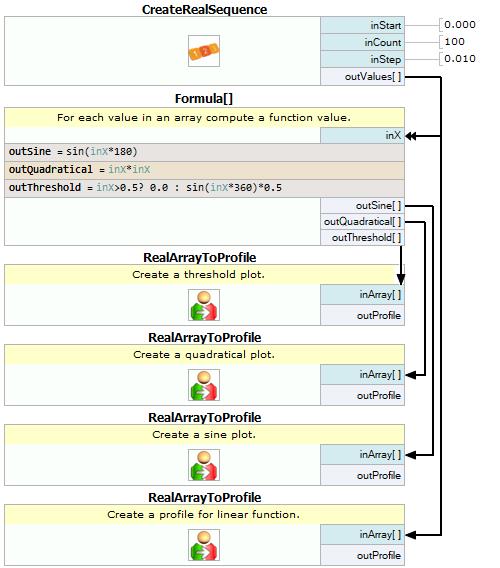
Add CreateRealSequence filter to the project and set inCount to 100 and inStep to 0.01. This filter creates an array of real values that will be used as function arguments.
-
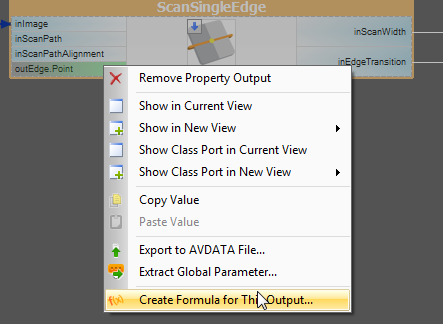
Add Empty Formula to the program and connect outValues to the new inX input of Real type. Formula can be easily created by right clicking on the Program Editor Window.
-
To calculate linear function value connect outValues with inArray.
-
To calculate sine function create a new formula output:
outSine = sin(inX180)*
-
To calculate quadratical function create another formula output:
outQuadratical = inX*inX
-
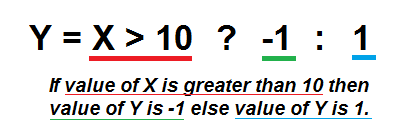
Calculation of the threshold function is more complicated. First, inX should be checked if its value is greater than 0.5. To do this, operator ?: should be used. The image below shows how to use this operator:
-
Add four RealArrayToProfile filters and connect their inputs to the formula's outputs (in case of the linear function take a look at point 3.).
-
Show output profiles in a single preview window.
Macrofilter Main is using formula to plot desired functions.
Further Readings
- Formulas - Detailed information about using formulas.