
You are here: Start » Getting Started » Running and Analysing Programs
Running and Analysing Programs
Example Projects
One of the best ways to learn Adaptive Vision Studio quickly is to study the example projects that come with the application. The File » Open Example... command is a shortcut to the location they are stored in. The list of available projects is also available in the Program Examples section.
Executing Programs
When a project is loaded you can run it simply by clicking the Run  button
on the Application Toolbar or by pressing F5. This will
start continuous program execution; results will be visible in the Data Preview panels. You can also run the program
iteration by iteration by clicking Iterate
button
on the Application Toolbar or by pressing F5. This will
start continuous program execution; results will be visible in the Data Preview panels. You can also run the program
iteration by iteration by clicking Iterate  or pressing F6.
When a project is loaded from a file or when new filters are added, the filter instances are displayed subdued. They become
highlighted after they are invoked (executed). It is also possible to invoke individual filters one by one by clicking
Step Over  or Step Into
  ,
or by pressing F10 or F11 respectively. The difference between Step Over and Step Into is related to macrofilters –
the former invokes entire macrofilters, whereas the latter invokes individual filters inside.
,
or by pressing F10 or F11 respectively. The difference between Step Over and Step Into is related to macrofilters –
the former invokes entire macrofilters, whereas the latter invokes individual filters inside.
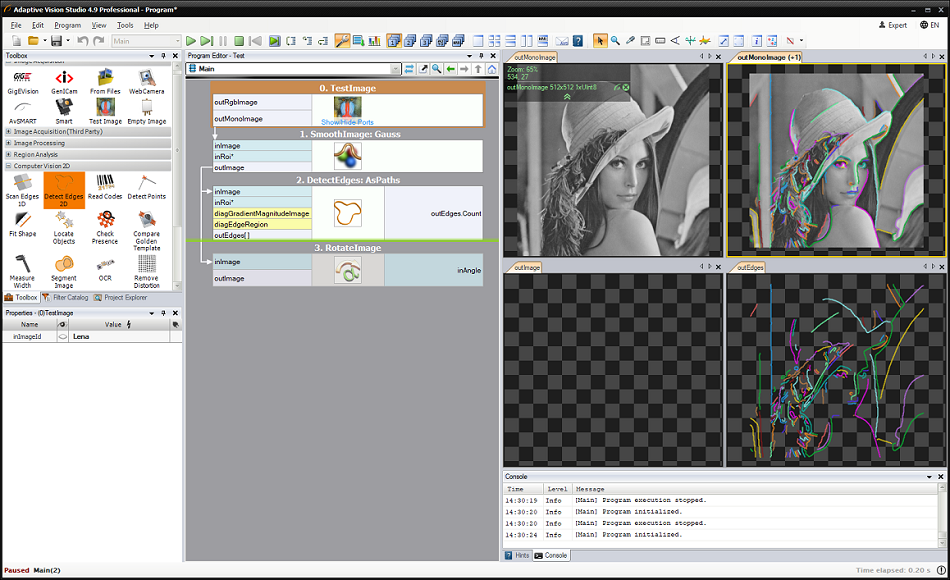
A program with four filter instances; three of them have been already invoked.
Viewing Results
Once the filters are executed, their output data can be displayed in the Data Previews panels. To display a value of a particular output, just drag and drop from the port of the filter to a Data Preview panel. Remember to press and hold left mouse button during entire movement from the port to the preview. Multiple data can be often displayed in multiple layers of a single preview. This is useful especially for displaying geometrical primitives, paths or regions over images.
User-defined data previews from individual filter outputs.
In bigger projects you will also find it useful to switch between three different layouts, which can be created to visualize different stages of the algorithm, as well as to the automatic layout mode, which is very useful for interactive analysis of individual filters:
Automatic data previews – the layout adapts to the currently selected filter.
Analysing Data
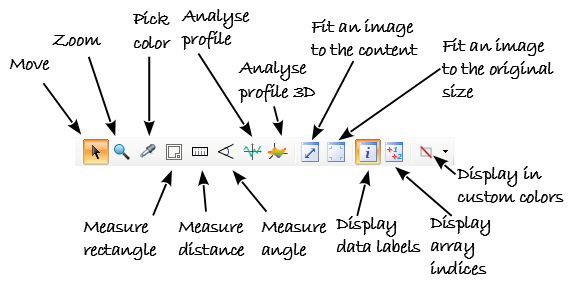
Data displayed in the Data Preview panels can be analyzed interactively. There are different tools for different types of data available in the main window toolbar. These tools depend on currently selected preview which is marked with a yellow border when window is docked.
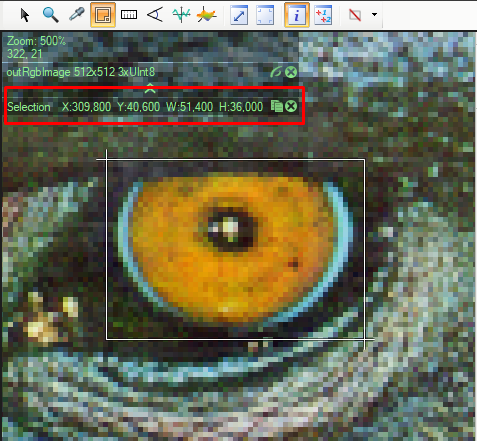
Measure rectangle - Selection |
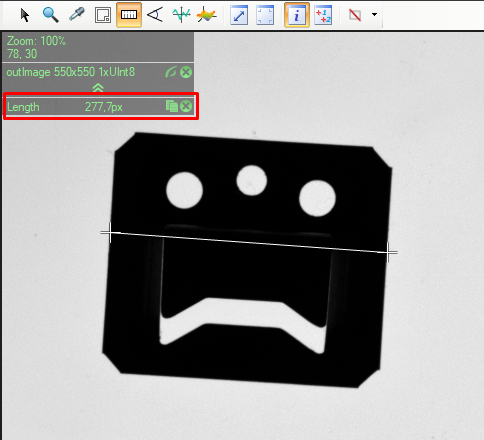
Measure distance - Length |
For the most common Image type the Data Preview window has the following appearance:
Additionally, there are several usability enhancements:
- Mouse Wheel – zooms in or out the image.
- 3rd Mouse Button + Drag – moves the view.
- Right Click – opens a context menu and allows to save the view to an image file.
Browsing Macrofilters
Except for the most simple applications, programs in Adaptive Vision Studio are composed of many so called macrofilters (subprograms). Instances of macrofilters in the Program Editor can be recognized through the icon which depicts several blue bars. Double clicking on an instance opens the macrofilter in the Program Editor.
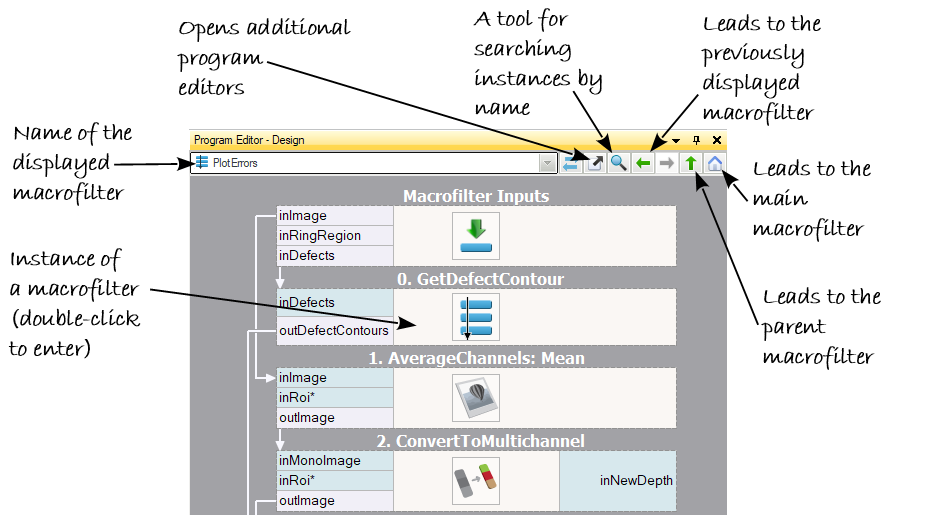
Browsing macrofilters in the Program Editor.
There are two other ways of browsing macrofilters. One is through the Macrofilter Navigator at the top of the Program Editor, which displays instances of macrofilters (how they are actually used and nested in the program). Another is through the Project Explorer, which displays definitions of macrofilters (a plain list of all macrofilters from which the user can create instances by dragging and dropping them to the Program Editor; double clicking on an item here opens the macrofilter in the Program Editor).
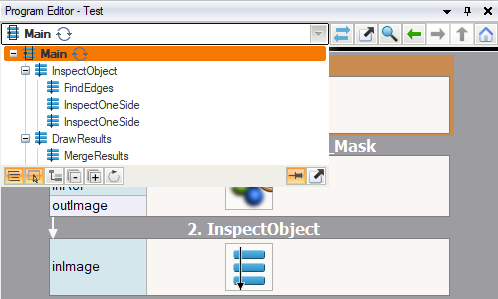
Instances of macrofilters in the Macrofilter Navigator. |
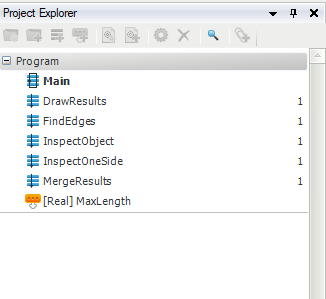
Definitions of macrofilters in the Project Explorer. |
Definitions of macrofilters correspond to definitions of functions in C++, whereas instances of macrofilters correspond to function calls on a call-stack. Unlike the C++, there is no recurrence in Adaptive Vision Studio and each macrofilter definition has a constant and finite number of instances. Thus, we actually have a static call-tree instead of a dynamic call-stack. This makes program understanding and debugging much easier.
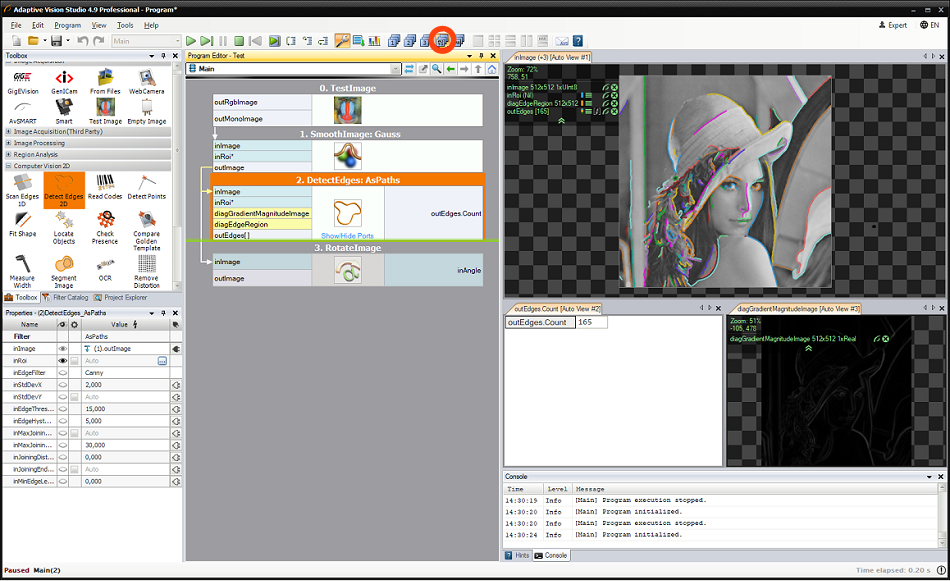
Analysing Operation of a Single Macrofilter
The Iterate Current Macro  command can be very useful when you want to focus on a single macrofilter in a program with many macrofilters.
It executes the whole program and pauses each time when it comes to the end of the currently selected macrofilter instance.
command can be very useful when you want to focus on a single macrofilter in a program with many macrofilters.
It executes the whole program and pauses each time when it comes to the end of the currently selected macrofilter instance.
The Iterate Current Macro command is very similar to setting a breakpoint at the end of some function in a C++ debugger.
Knowing Where You Are
At each moment of a program execution you can see on the Application Status Bar which macrofilter instance is currently being executed. This is called a call-stack, because not only the name of the macrofilter is displayed, but also all the names of the parent macrofilters.
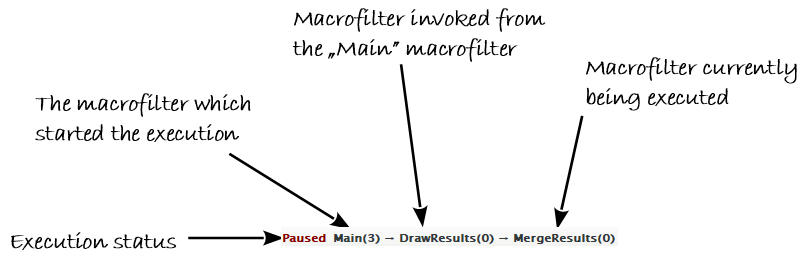
The call-stack of the Application Status Bar
The current position of the execution process is also marked with a green line or frame in the Program Editor:
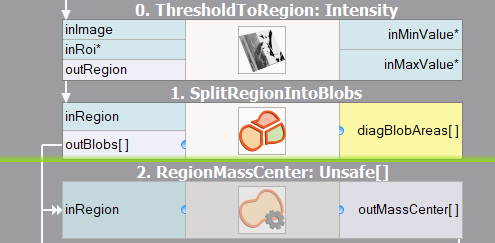
Execution marker showing the exact position of the execution process. |
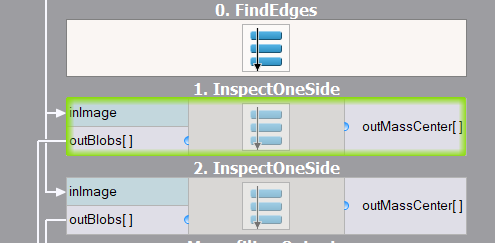
Execution marker showing that the execution process is currently inside this macrofilter instance. |
| Previous: Introduction to Data Flow Programming | Next: Acquiring Images |